However, also the concentrations of several other greenhouse gases, such as methane (CH4) and nitrous oxide (N2O), are increasing. For these gases expanding agricultural activities are the primary cause. Still a lot of questions remain with respect to the life cycles of these important non-CO2 greenhouse gases.
In the European project HYMN (Hydrogen, Methane and Nitrous oxide) three atmospheric trace gases have been studied: CH4, N2O and hydrogen (H2). The atmosphere-biosphere interactions of these three gases are tightly coupled. H2 is not a greenhouse gas. The presently increasing interest in H2 is related to the possible transition to a hydrogen economy that may occur within the coming decades. A switch to H2 as alternative energy source – assuming that the H2 is produced using renewable energies and would replace fossil fuels, could have benefits for both air quality and climate, but the possible environmental impacts need to be evaluated.
The three-year HYMN project started in 2006 and was executed by a multi-disciplinary consortium of 12 institutes and universities in Europe led by KNMI. In this highlight we focus on the life cycle of CH4.
The importance of CH4 emissions for climate change
In 2007 the global-mean CH4 surface concentration was 1790 ppbv (parts per billion by volume), in 2008 it reached 1797 ppbv, and the preliminary data for 2009 show continued growth in CH4. This increase came after a period of near-zero growth from about 1999 to 2006. Present-day CH4 concentrations are more than a factor 2.5 larger than pre-industrial concentrations due to anthropogenic CH4 emissions.
CH4 emissions are contributing importantly to climate change. There are several arguments underlining this importance: The increase in anthropogenic CH4emissions since 1750 has resulted in a climate forcing of almost 1 Wm-2, which can be compared to 1.6 Wm-2 for CO2 emissions1). CH4 has a 100-year global warming potential (GWP) of 25 relative to CO2, and therefore it is a more powerful greenhouse gas than CO2. An important reason for the higher GWP of CH4 is that the chemical breakdown of CH4 in the atmosphere additionally causes increases of tropospheric ozone and stratospheric water vapour, which are taken into account in the GWP. In addition, CH4 is more effective than CO2 in warming the surface on a per molecule basis, also because, compared to the CO2 forcing, a larger part of the CH4 forcing occurs in the troposphere. On the other hand, perturbations of CH4 have a much shorter lifetime (about 12 years) than those of CO2 (of the order of centuries).
Improved knowledge on CH4 emissions
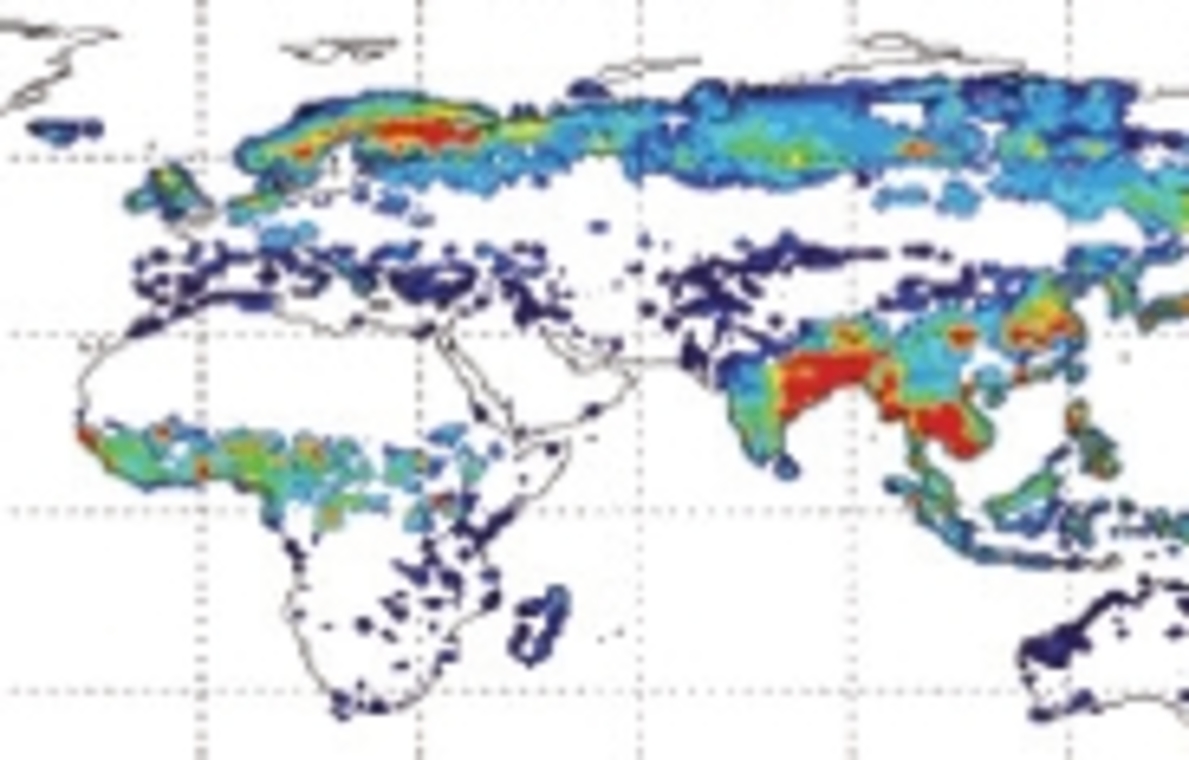
The largest contribution to the CH4 emissions of anthropogenic origin is the release of digestive gases by ruminants (cattle) which constitute about one third of all anthropogenic emissions. Other important anthropogenic sources are emissions related to fossil fuel use (coal mining, gas leakages) which constitute another third, and the treatment of waste (landfills). Rice cultivation and biomass burning are also anthropogenic sources of CH4. Total present-day anthropogenic emissions exceed the natural total emissions by more than 50%. Natural CH4 emissions are dominated by wetlands, i.e. saturated soils, peat lands, bogs, swamps, marshes, etc., and these emissions depend on the actual local climate conditions. Figure 1 shows the wetland CH4 emission distribution for two months in 2004 calculated with a global dynamical vegetation model2). The figure shows that tropical regions as well as the northern extra-tropics are important emission regions. The figure also shows that the exact location of the major emission regions varies with the season.
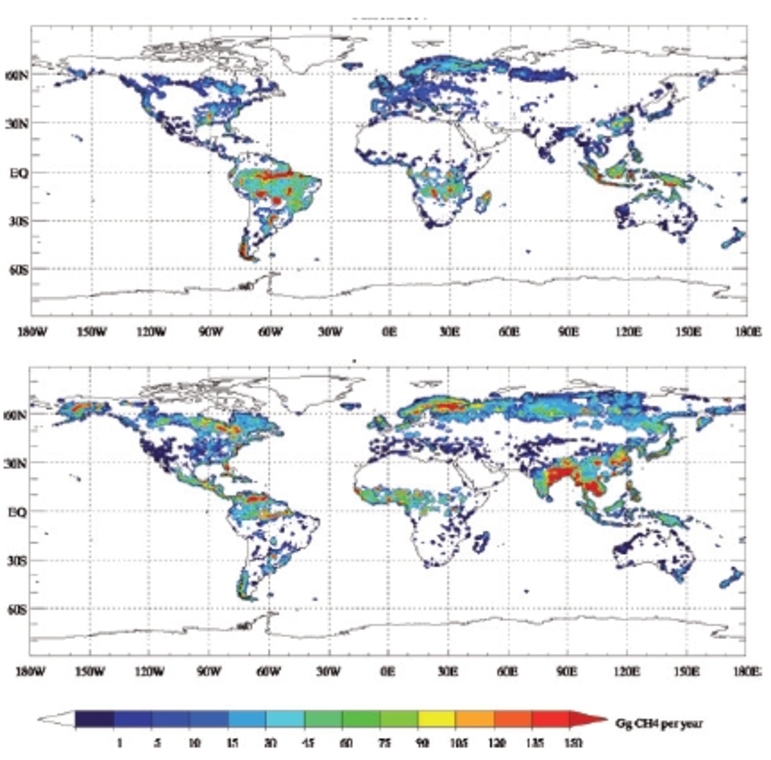
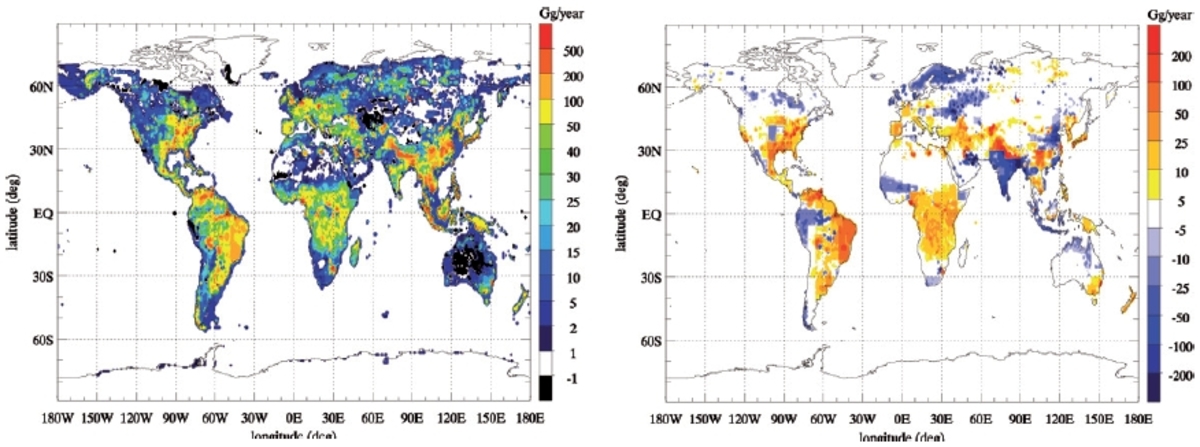
Within the HYMN project the retrieval of CH4 from the SCIAMACHY satellite instrument has been significantly improved by implementing improved spectroscopic information (3,4). The satellite data are used together with surface observations of CH4 to constrain the geographical distribution and temporal variations in the natural and anthropogenic CH4 emissions. The top panel of Figure 2 shows the improved emission distribution for the year 2004. Important anthropogenic emission regions are, for example, the densely populated areas of Asia, North- and South-America and Europe, while natural emissions are large over Amazonia and some other large river basins such as those of the Orinoco, the Mississippi, and the Ganges. The lower panel of Figure 2 shows the differences with the prior assumed CH4 emissions, which are either taken from the vegetation model (Figure 1) or, for the anthropogenic ones, estimated from socio-economic statistics (e.g. the number of cows per country). Some care is needed in the interpretation of the patterns in the lower panel as many factors contribute to the final result. The picture over Asia is complex and mixed, including, e.g., a northward redistribution of emissions within India. Wetland CH4 emissions are estimated high over certain regions (e.g. Scandinavia) and low over other regions (e.g. central Africa). Ruminant emissions over Brazil are larger than assumed a priori, conspicuously because Brazil has experienced a rapid increase in cattle number over the years. In 2006 the UN Food and Agriculture Organisation FAO has noted that Brazil has become the largest meat (beef) exporter in the world.
Figure 2 shows that CH4 emissions at tropical latitudes dominate over extra-tropical emissions even more than expected a priori. It has been suggested that large increases in northern CH4 emissions might lead to a tipping point in climate(5). However, even though the temperature-sensitivity of northern CH4emissions is well-established we found as yet no observational evidence for large increases in CH4 emissions related to permafrost melting or destabilisation of hydrates in response to Arctic warming.
Inter-annual variability
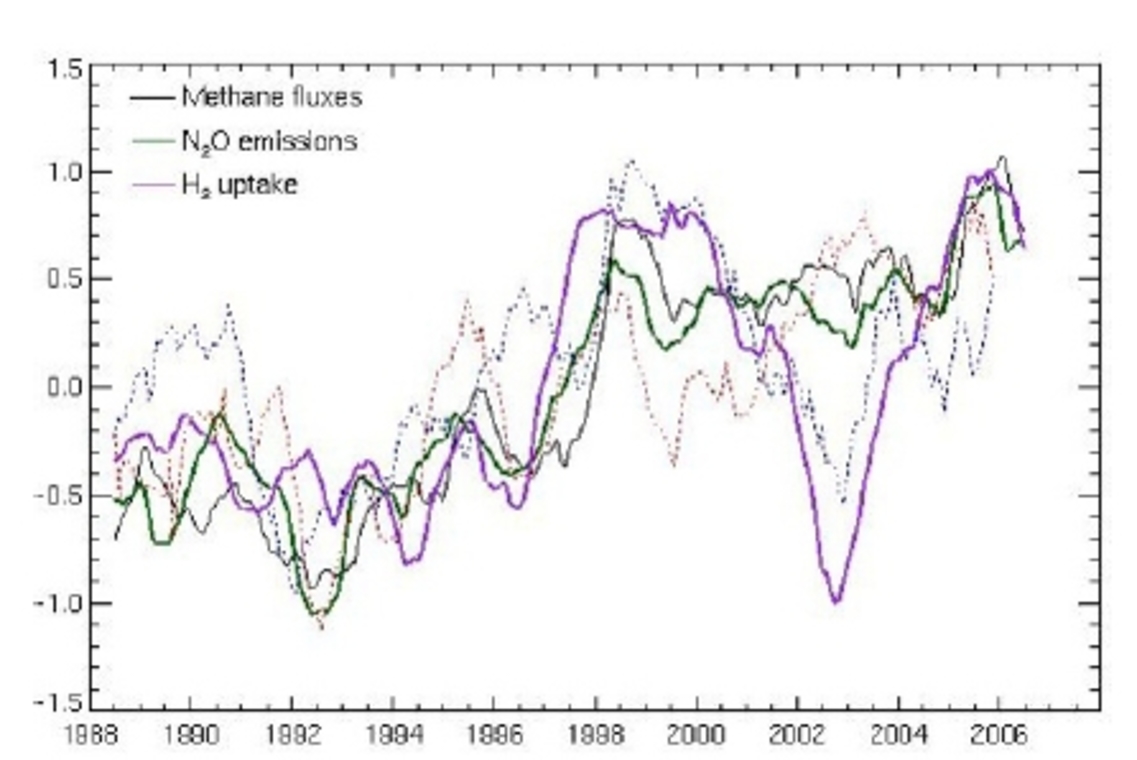
Inter-annual variability in global CH4 concentrations is caused by variations in the natural CH4 emissions and by variations in the chemical breakdown of CH4 in the atmosphere. Figure 3 shows the variability in the natural net CH4 surface fluxes (i.e. emissions minus soil uptake) over the period 1988-2006, as well as variations in surface temperature and precipitation. The figure shows that the CH4 variability is largely driven by the variations in surface temperature and rainfall. Figure 3 also shows the natural net exchange fluxes of N2O and H2, which are highly correlated with the CH4 fluxes, except for a strong decrease in H2 uptake during 2002 when global precipitation levels dropped. The figure shows that trends and variations in the global natural surface fluxes of CH4probably have been limited over the considered time period. On the other hand, because a climatology for inundated areas has been used instead of actual inundation observations, the inter-annual variability is likely underestimated in the figure. Variations in temperature, humidity and incoming solar ultraviolet radiation in the tropical lower troposphere drive inter-annual variations in the chemical breakdown of CH4. Chemistry model simulations have indicated that, over the last two decades, trends and inter-annual variations in the meteorologically driven loss rates are likely to have been limited (6).
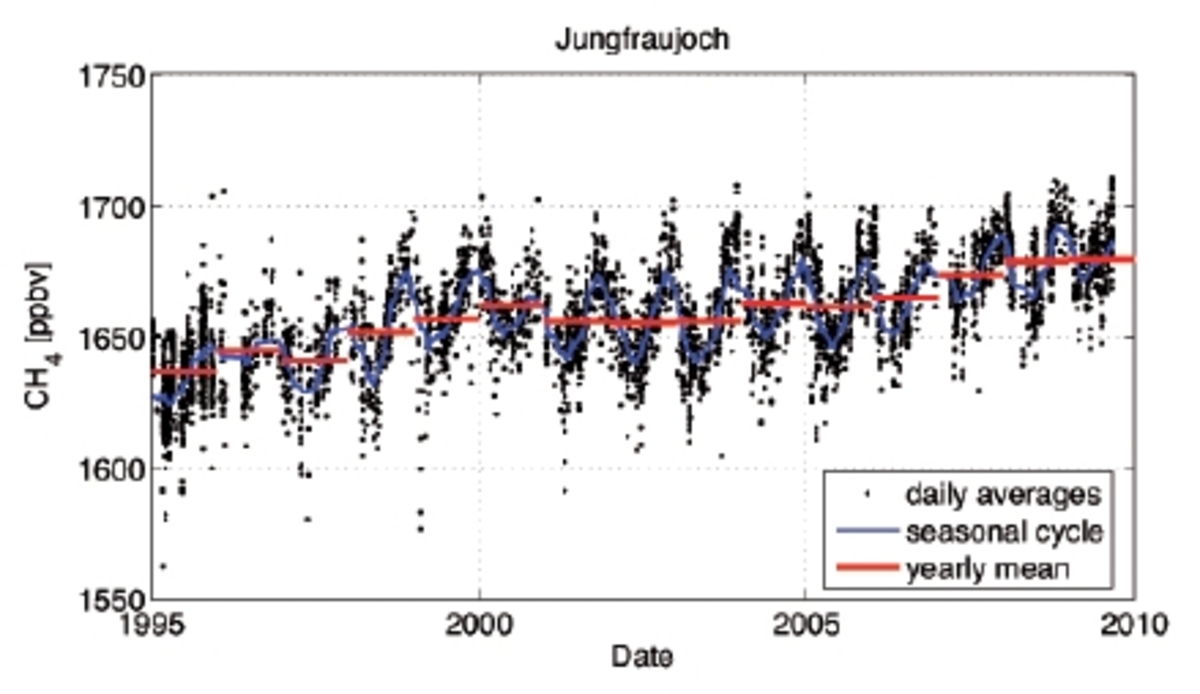
Even though the inter-annual variability in CH4 loss rates has been small, a long-term trend in the chemical loss can not be ruled out. Over the last 15 years the annual growth rate in CH4 has been consistently smaller than in the 1980s when growth rates regularly exceeded 10 ppb per year. Figure 4 shows the gradual increase in tropospheric CH4 since 1995 observed at Jungfraujoch, Switzerland. These column observations are in line with the evolution seen by the global surface networks for CH4. A period of near-zero growth (1999–2006) has recently been followed by renewed moderate growth. It has been suggested that the lack of growth after 1999 was largely due to an episodic reduction in the tropical natural emissions related to sustained relatively dry conditions in the tropics, and it was predicted in 2006 that the CH4 growth rate would probably recover soon in response to further increasing anthropogenic CH4 emissions (7).
Per year the present-day anthropogenic emissions are growing faster than in the 1980s and most of the increase in the annual emissions since 1995 has occurred after the year 2000. These emission increases can not easily be reconciled with the moderate annual growth as shown in Figure 4 – unless the chemical lifetime of CH4 would be significantly shorter now than in the 1980s. Note that there are no indications for large sustained reductions in natural CH4 emissions (Figure 3).
In HYMN it has been found that the global CH4 lifetime is sensitive to air pollution, and mostly to nitrogen oxides (NOX) emitted under sunny, warm and humid conditions such as in the tropics. Rapid increases in low-latitude NOX emissions have recently been observed by satellite NO2 instruments such as OMI and SCIAMACHY. An estimated decrease of 3-5% (6) in CH4 lifetime due to increased (sub-)tropical NOX pollution since about 1995 could compensate for 15 – 25 Mt of CH4 emissions per year, which is a significant fraction of the annual emission increase. Therefore, evidence is emerging that the current moderate growth in CH4 is primarily caused by the wide-spread presence of (sub-)tropical air pollution and less by CH4 emission mitigation.
The increase in N2O in the atmosphere from a pre-industrial level of 270 ppb to about 322 ppb in 2008 is largely caused by expanding agricultural activities and has resulted in a radiative forcing of 0.16 Wm-2. N2O has a chemical lifetime of more than 100 years and is thus much longer lived than CH4. The relatively large pre-industrial concentration of N2O shows the relative importance of natural N2O emissions, mainly from vegetated soils. Natural N2O emissions are largest over tropical forests and savannas, and are estimated to sum globally up to 11 ± 3 TgN per year (including a minor ocean source), still exceeding anthropogenic N2O emissions (7 ± 1 TgN per year).
Hydrogen has a chemical lifetime of only about 2 years. The present-day H2concentration of about 550 ppb is largely a product of atmospheric chemistry and the uptake by soils (Figure 3). Future air quality and climate scenarios will need to include hydrogen (H2) emissions, such as e.g. from leakages, to assess the possible impacts on atmospheric composition and climate, most notably by increasing stratospheric water vapour. The transition to a hydrogen economy might mitigate climate change due to the potential CO2 emission reduction. Clear advantages for future air quality are found because of the reduction in air pollution by fossil-fuel burning associated with a hydrogen economy.
By observations and model calculations the EU-funded project HYMN has provided improved insights in the life cycle of CH4 and some other gases in the atmosphere. Key findings are that (sub-)tropical latitudes are dominant for CH4emissions and chemical breakdown and thus also for inter-annual variability in CH4 and, secondly, that evidence is emerging that the atmospheric lifetime of CH4 is being reduced by increasing (sub-)tropical air pollution. Continued observations of atmospheric composition are essential to get a better understanding of the chemistry-climate interactions and relations between climate change and other important environmental issues related to the trace gases CH4, N2O, and H2, such as the recovery of the ozone layer in the 21stcentury and future changes in global air quality.
We are indebted to the participants in the HYMN project for providing materials and results. Figures 1 and 3 courtesy of Renato Spahni and Rita Wania (University of Bristol), and figure 4 courtesy of Emmanuel Mahieu and Pierre Duchatelet (University of Liège).