The conclusion was that in the twentieth century, a winter as cold as the winter of 2010 or colder occurred once every six years. Due to the warming trend in the Netherlands the return time has now increased to approximately once every fifteen years. The large amount of snow, which caused most problems, was much more unusual. In this article we investigate the global return times of temperature and snow cover.
The cold and snowy winter of 2010 caused many problems in Europe and the United States. In general, the weather causes trouble when it falls outside the bandwidth to which society is adapted. One way to look at this is to compute return times: the time that on average elapses between two events. In the Central England Temperature series there are 56 winters out of 350 that were colder than the winter of 2010 (2.4 ºC), so the return time is just over six years in the climate of 1660-2009. Large return times are estimated by fitting a Generalised Pareto Distribution to the tail of the observed distribution. A large return time implies that the weather is very unusual, and may cause trouble. (Exceptional weather is not always a problem: the extraordinarily warm autumn of 2006 was quite enjoyable.)
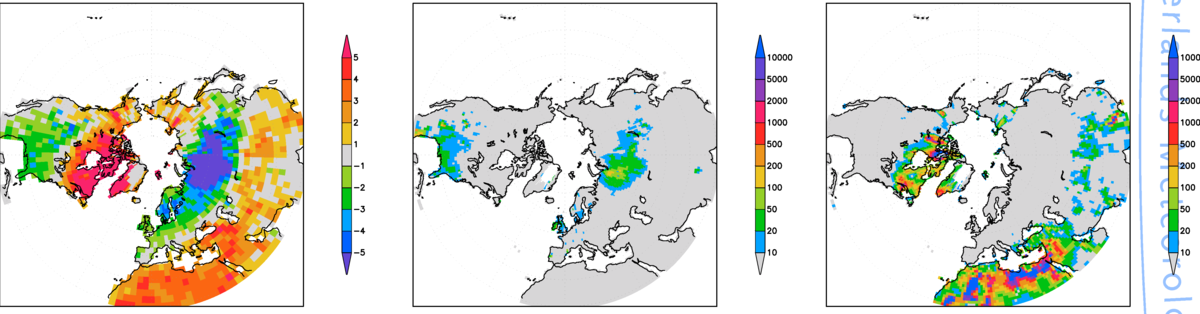
In Figure 1 the return times for the temperature of the winter of 2010 are plotted assuming a stationary climate. The pattern of temperature anomalies of this winters shows two areas with below-normal temperatures (Europe/Siberia/China and the United States) and two regions where the winter was milder than usual (Canada/Greenland and North Africa/Middle East). If the climate would not be changing we would not be able to call the winter very cold in many areas: return times are less than once every ten years in Europe, 10-50 years in the southern US and reach 100 years in Siberia. The warm extremes would be much more unusual: up to 200 year in northeastern Canada and southern Greenland, and much higher still in North Africa and the Middle East.
However, due to global warming the probabilities of cold extremes have decreased and the chances of warm extremes have increased. This has not been taken into account in Figure 1. In Figure 2 we attempt to estimate the return times in a changing climate. This has been done by subtracting the trend from the observations at each grid point before computing the return times. The trend is defined as a locally varying factor times the smoothed global mean temperature rise.
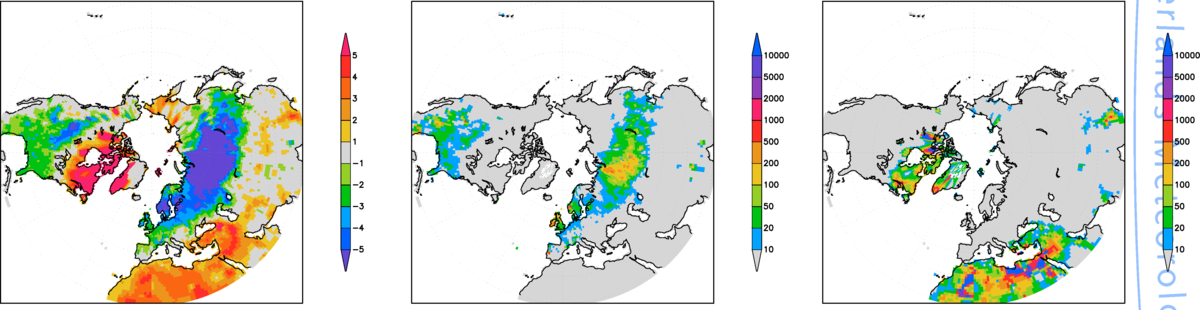
As expected, the return time of the winter temperature of 2010 relative to the trend is higher than under the assumption of an unchanging climate. In the Netherlands it becomes 10 to 20 years, rising to 100 years in Scotland. In the US the return times relative to the trend are similar, as the winter trend is small compared to the variability. The return times in North Africa and the Middle East have become smaller, but still reach thousands of years. It should be noted that these extrapolations from 60 years of data have large uncertainties. A glance at the temperature series of Egypt shows that the temperature of winter 2010 really jumps out of the series: three degrees higher than the mean, one degree above the previous record.
The winter of 2010 was more exceptional in the large quantities of snow than in the temperature, both in Europe and in the United States. The deviation of winter-averaged weekly NOAA snow cover from the 1971-2000 normals is shown in Figure 3. In Europe, the United States and China there was a lot more snow on the ground than usual this winter, in Central Asia there was less snow. The return times in the United States vary largely, in most places this much snow is not very uncommon, but there are a few exceptions. In Europe the return times reach once every 20-50 years in Germany, North Germany and Scotland. The snow in Spain was really exceptional.
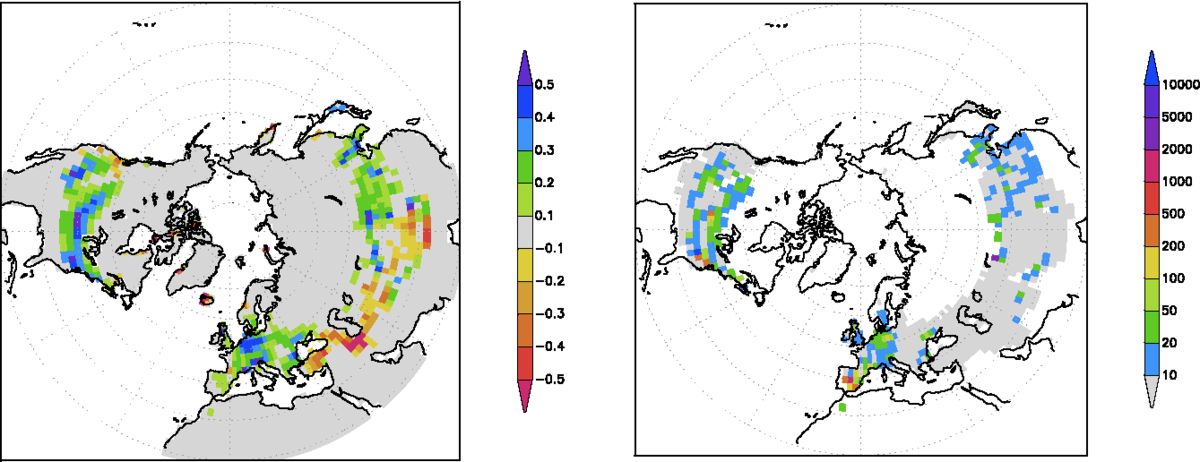
It is not yet possible to adjust these return times taking global warming into account. In some areas a higher temperature will lead to less snow because it will become too warm for snow to remain on the ground. In other areas we expect more snow, because warmer air can contain more moisture or because of projected changes in atmospheric circulation. It is not yet clear which effect will dominate where. In the observations there are no significant trends yet in winter snow cover.
The winter of 2010 was mainly notable because of the large amounts of snow in Europe and the United States. The temperature deviation was less exceptional. Statistically the high temperatures in North Africa and the Middle East were very rare.