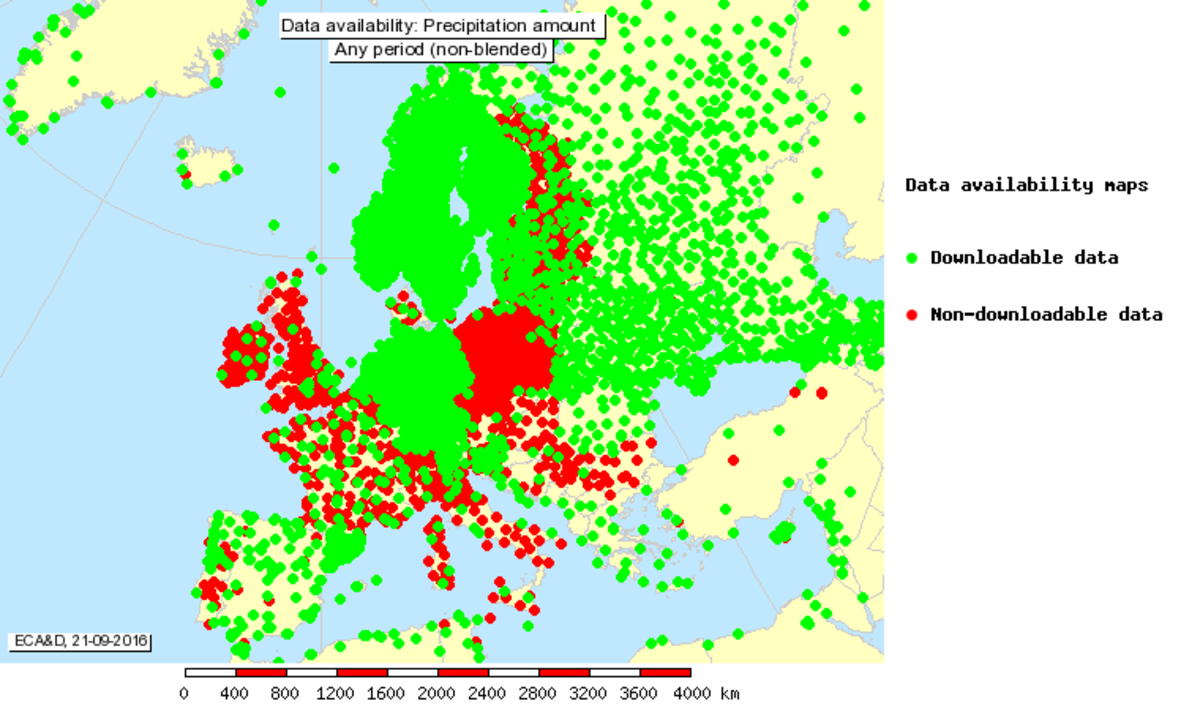
In order to facilitate climate research on the European domain, the European Climate Assessment & Dataset (ECA&D) has been developed.
Initiated by KNMI and the European Climate Support Network in 1998, it has received financial support from EUMETNET and the European Commission and it aims to provide access to daily observations of essential climate variables. The network of stations currently consists of more than 10500 stations (figure 1).
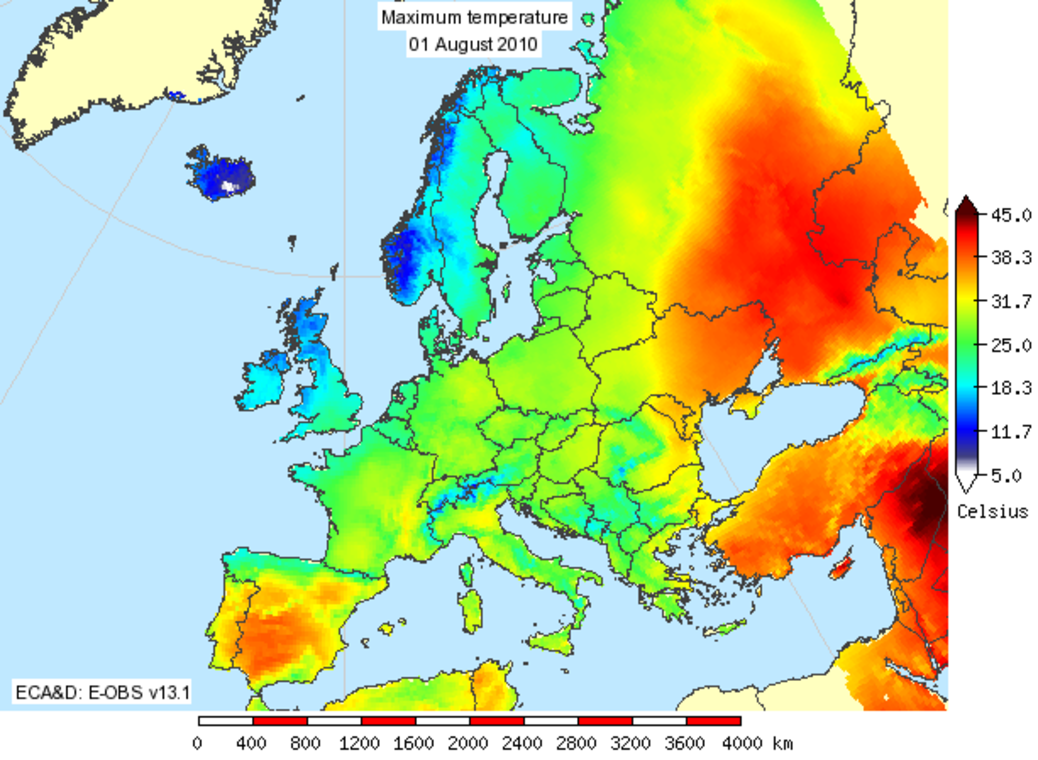
On the basis of the station data, a gridded dataset is produced which is known as E-OBS. The current version 13.1 (Sept. 2016) contains daily values of precipitation, temperature (maximum, minimum and daily average) and sea level pressure at 0.25° resolution on a regular longitude-latitude grid and 0.22° resolution on a rotated grid (figure 2).
Both the station data and the gridded data enjoy heavy use by the scientific community. At the end of 2016, the articles which describe the station dataset and the gridded dataset have both been cited approximately 900 times. The use of E-OBS is increasing, with some 60 new users each month downloading the dataset.
Although E-OBS was originally aimed for the Regional Climate Modelling community, providing data to validate their models, the use of E-OBS has now spread to other disciplines like hydrology and biology. E-OBS is also used frequently for education.
The station and the gridded data serve as a basis for derived products that can be used to monitor European climate variability and change. Examples are return values to evaluate the intensity and frequency of more rare climatological events, and maps of Climate Impact Indices both as deviations from their climatological value and as trends. The latter maps account for homogeneity (or the lack of it) of the underlying data.
Klein Tank, A. M. G., et al. "Daily dataset of 20th‐century surface air temperature and precipitation series for the European Climate Assessment." International journal of climatology 22.12 (2002): 1441-1453.
Haylock, M. R., et al. "A European daily high‐resolution gridded data set of surface temperature and precipitation for 1950–2006." Journal of Geophysical Research: Atmospheres 113.D20 (2008).