Following the late snow melt and several wet months in spring, the soils were saturated and reservoirs filled. The excess of precipitation resulted in high water levels in European rivers such as the Danube, Elbe, and Rhine. Water levels of the Danube in Passau and Budapest exceeded their highest point in at least 100 years. Water levels of the Elbe in Dresden did not reach the record high value of 2002. The large scale flooding along the river banks caused extensive damage. Thousands of people had to be evacuated from places in Germany, Czech Republic and Austria. At least 14 casualties have been recorded (source: Wikipedia).

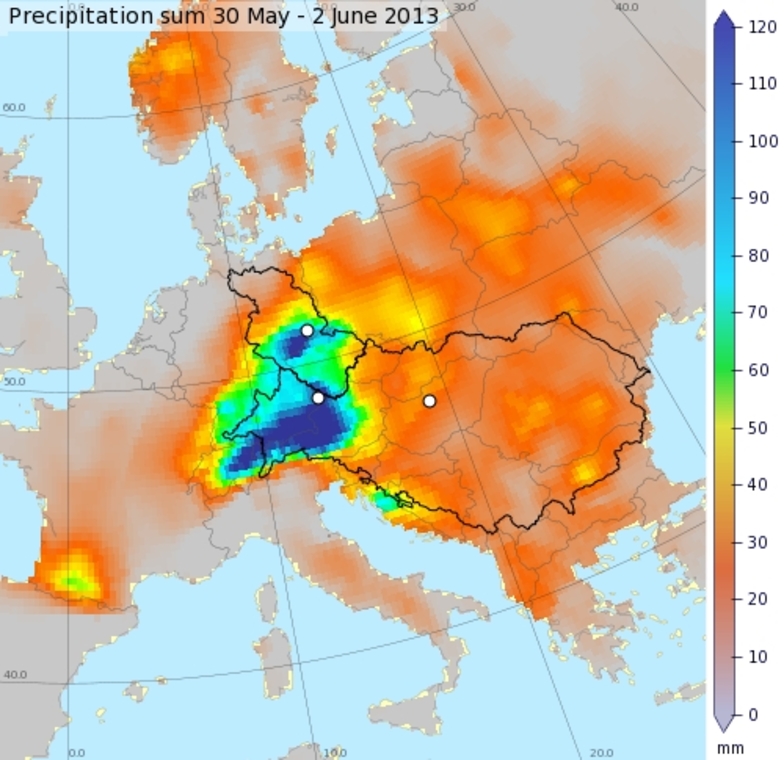
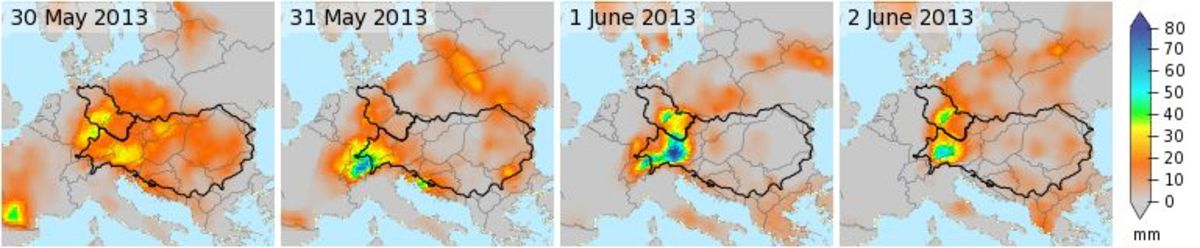
Precipitation amounts during late May / early June reached values over 100 mm in a sizeable area covering large part of Switzerland, Austria, southern and eastern Germany and Czech Republic (Figure 2). The highest amounts were observed on the last two days of May and the first two days of June (Figure 3). Some stations recorded over 200 mm in this period. Many places received as much as the normal monthly precipitation amount within one or two days time.
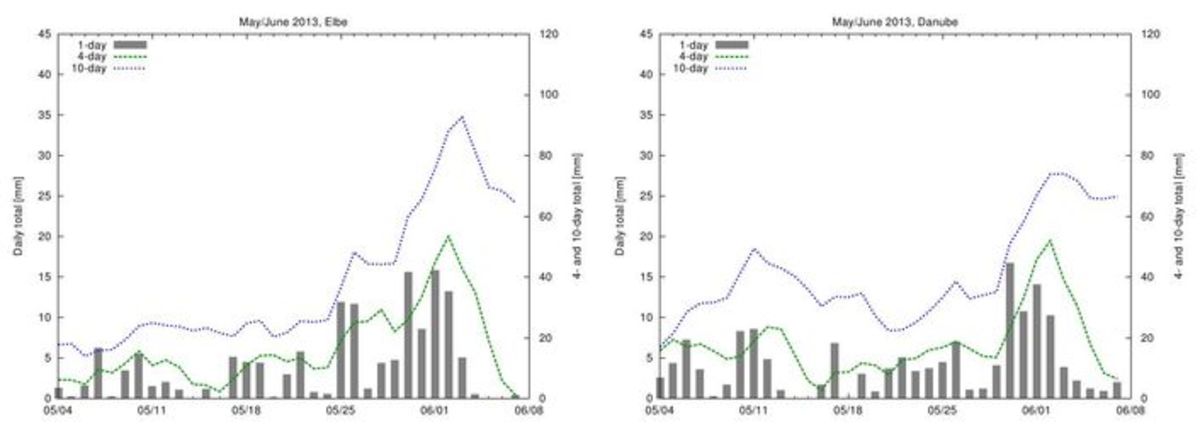
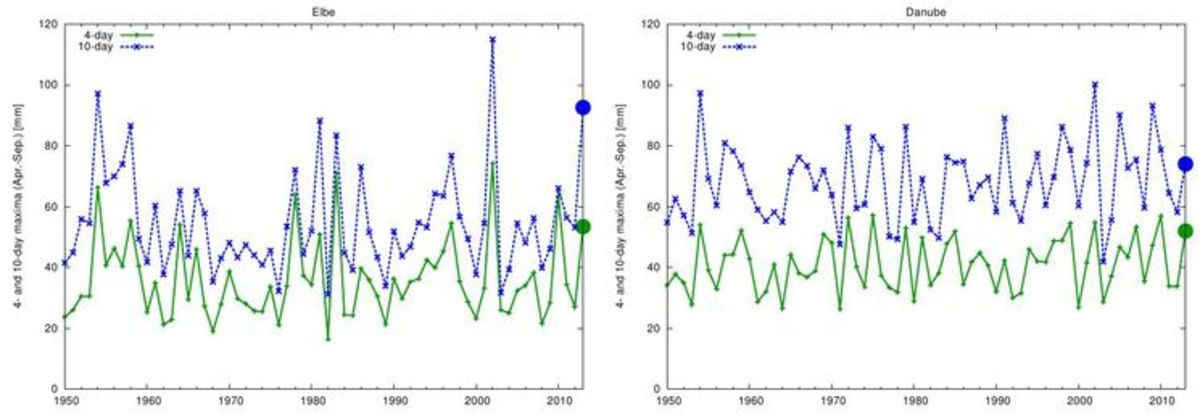
For the two main river basins in the region (Elbe and Danube), the area average 1-, 4- and 10-day accumulated precipitation amounts reached values of 16, 53 and 93 mm for the Elbe, and 17, 52 and 74 mm for the Danube (west of 20° East), respectively (Figure 4).
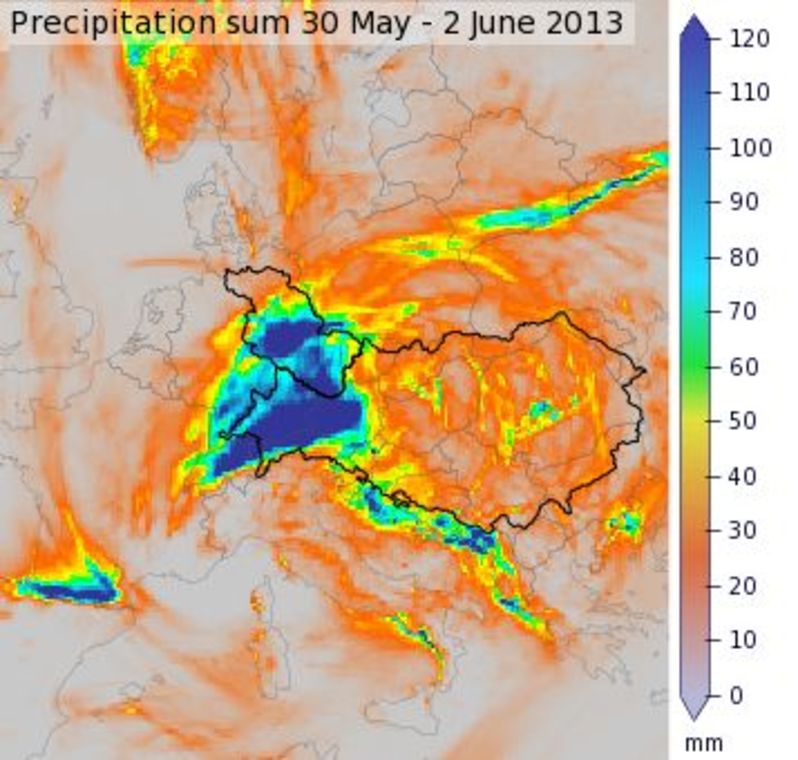
All figures above are derived from E-OBS, a daily gridded dataset for Europe based on station observations. New state-of-the-art products based on satellite data and model reanalyses potentially provide more spatial detail as illustrated for the current event in Figure 5. However, no multidecadal datasets of such products are currently available. These are required to place the current event in a long-term perspective. Multidecadal reanalysis datasets are being developed as part of projects such as EURO4M (of which this bulletin is a product) and its successor UERRA.
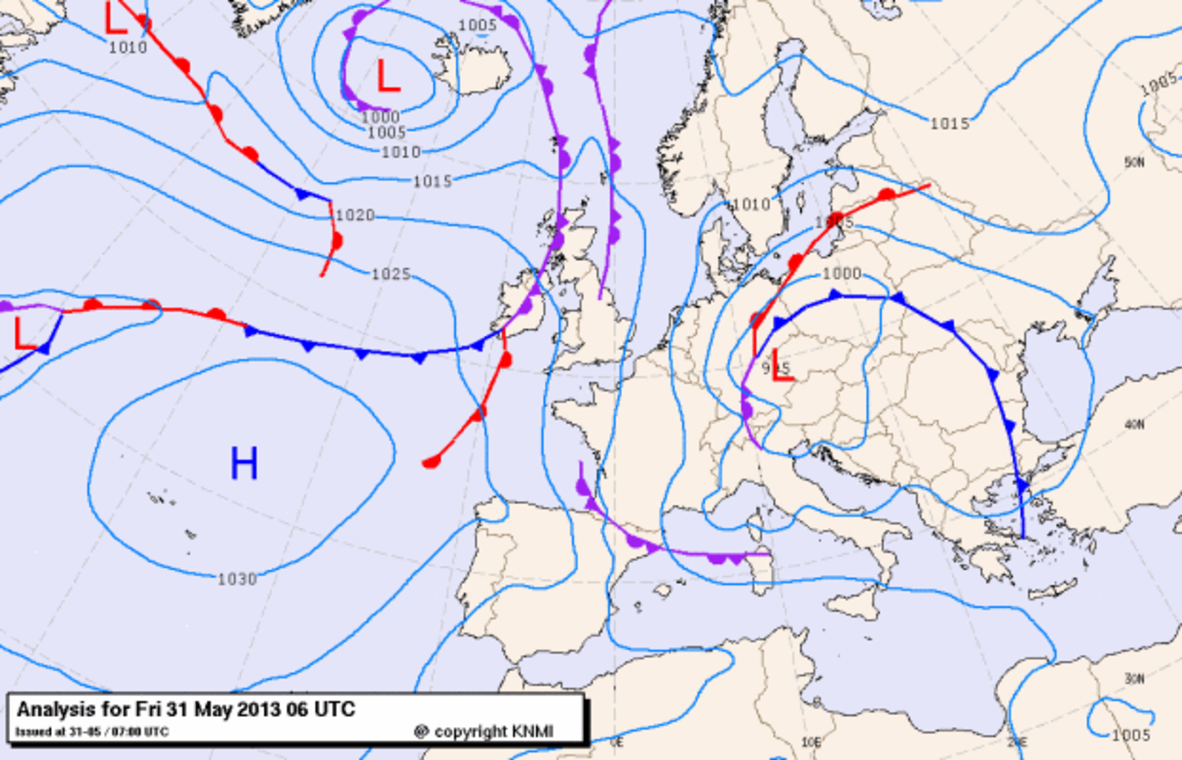
An extensive depression system migrated from the North Sea southeastwards at the end of May (Figure 6). The depression brought large amounts of moisture from the Mediterranean, and steered it in a wide arc over Eastern Europe to the northside of the Alps, where it collided with very cold air from the North in the upper levels. Situations like this are common, but the exception this year was that the low remained stationary at the peak of its development rather than to move away which commonly occurs. Precipitation was intensified even further because the airflow was forced over the Northern Alpine ridge (source: ZAMG, Austria). Also exceptional was the fact that this event occured very early summer at a time that snow had not melted completely because of the cold spring season. The weather situation and the accompanying extreme precipitation was in most of the weather forecasts published before the event.
In the past, several significant precipitation events of similar magnitude occured in this region. Considering large scale impacts in particular the event of August 2002 is noteworthy. During this event the weather situation was similar and comparable precipitation totals were recorded
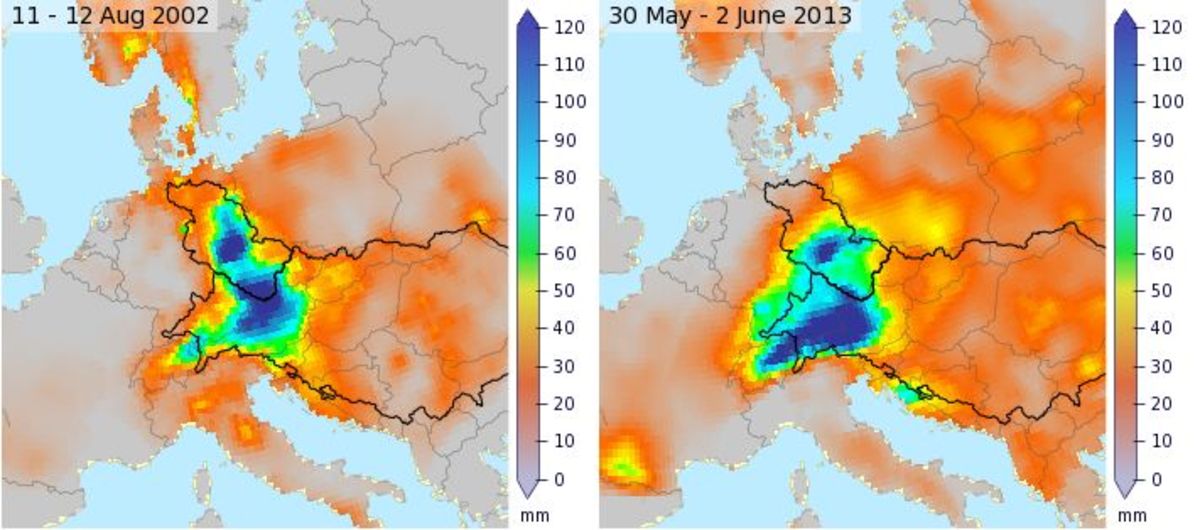
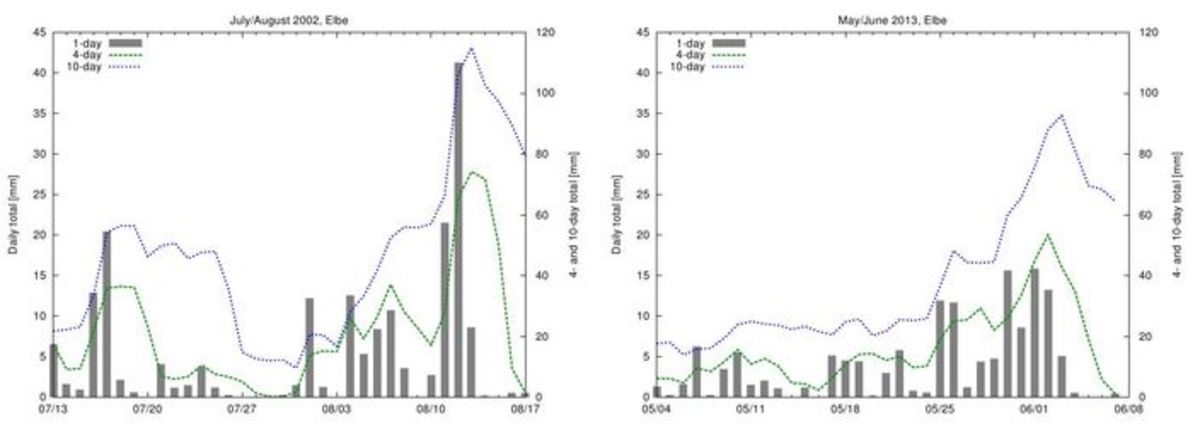
Despite the similarities in the pattern of total precipitation, the characteristics of these two events were very different in particular for the Elbe. In 2002 precipitation was concentrated in a shorter time interval with a much higher daily maximum of 41 mm (averaged over the Elbe basin) on 12 August 2002 compared to 16 mm on 1 June 2013 (Figure 8).
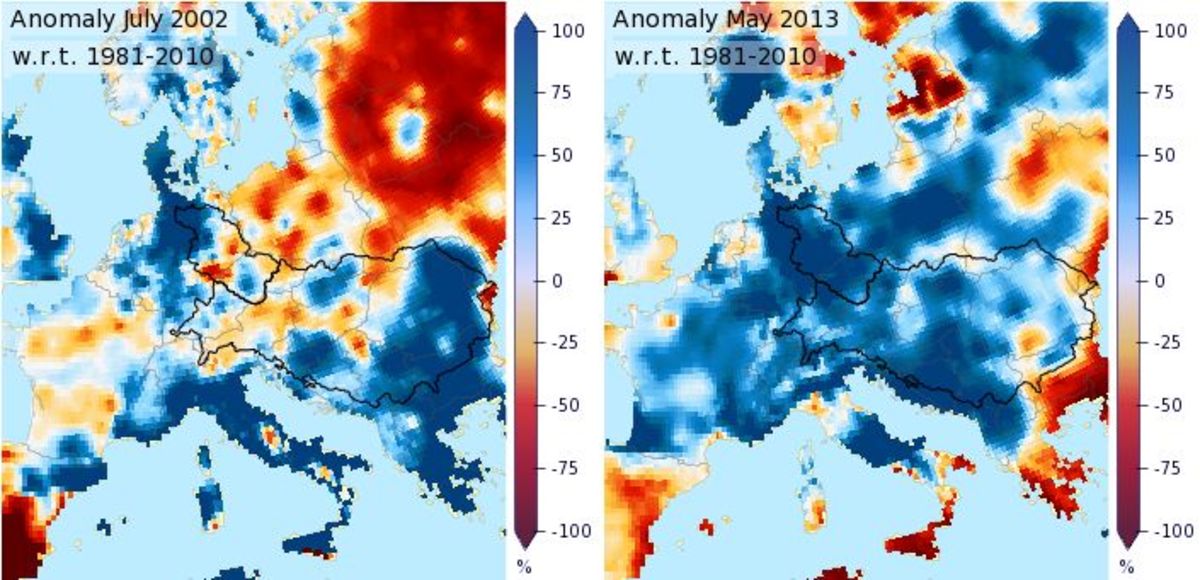
Also, the antecedent conditions of these two events differ. In 2013 the month of May was very wet with most of the area receiving twice the amount of what is usual. Soil moisture reached record high values in a large part of Germany (source: BfG, 2013). The month of July 2002 was less wet in the Elbe and Danube river basins (Figure 9).
Besides these differences in daily intensities during the event and antecedent conditions more subtle differences in the exact timing of the precipitation in each sub-basin and developments in water management may have further contributed to the differences for the recent extreme river discharge and flooding compared to the August 2002 event (and thus to the different impacts on society).
Since 1950 (the start of the E-OBS dataset for Europe) the 4- and 10-day precipitation amounts in the Elbe and Danube basins reached peak values between April and September at or above the current May/June 2013 values several times (Figure 10). There is no clear indication of clustering of the more extreme events towards the end of the time series. Therefore, the data do not indicate that these extreme events occur more often now than in the 1950s as a result of a warming climate.
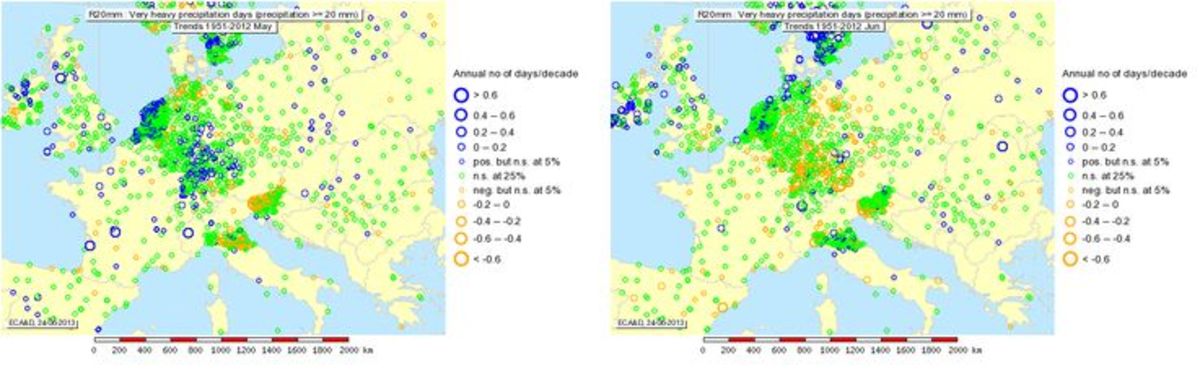
Other indicators for changes in extreme precipitation in this area do not show any clear climate change signal either (source: ECA&D). The station trends in the number of days with (very) heavy precipitation do not indicate wide-spread positive values in the region since 1950. Figure 11 suggests a trend towards more heavy precipitation days in May while the opposite seems the case in June, but non-significant station trends (green circles) generaly dominate the map.
A similar pattern emerges when the trends for the shorter period since about 1980 are considered (not shown). This is different from the winter season in which a significant shift towards wetter conditions dominates in this region.
In conclusion, there is no convincing evidence of a tendency towards more extreme precipitation events in this region during the warm season. But climate change effects cannot be ruled out completely. The German Weather Service has calculated that the frequency of the weather pattern associated with the current and many earlier events has increased (source: DWD). Climate models project that heavy precipitation events will increase in frequency, intensity and/or amount under global warming over many land areas. Recent model projections indicate that the extreme runoff frequency increases for the Rhine basin (results for the Elbe basin are not available) but decreases for the entire Danube basin (including the more eastern part not considered here) in a warmer world (source: Hirabayashi et al., 2013). Disentangling the exact causes of the extreme precipitation requires more research. This includes the role of the observed high Sea Surface Temperatures in the eastern Mediterranean and especially the Black Sea (the source area for the moisture), and an analysis of whether the persistence of the low pressure system was enhanced by the larger stationarity of meanders in the Northern Hemisphere jet stream.
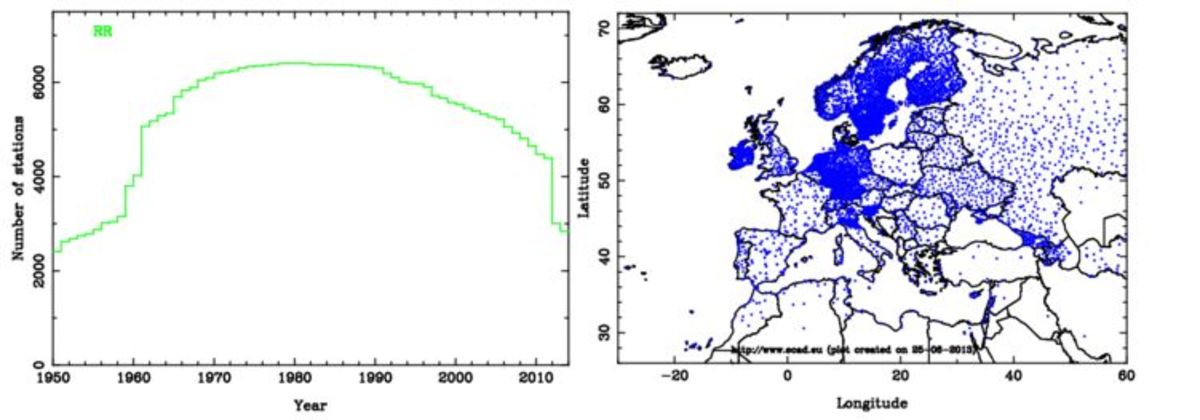
E-OBS version 8.0 with underlying station data from ECA&D. The time series plot shows the number of stations available in each year for precipitation.
We acknowledge the E-OBS dataset from the EU-FP6 project ENSEMBLES and the data providers in the ECA&D project.
Haylock, M.R., N. Hofstra, A.M.G. Klein Tank, E.J. Klok, P.D. Jones, M. New. 2008: A European daily high-resolution gridded dataset of surface temperature and precipitation. J. Geophys. Res., 113, D20119, doi:10.1029/2008JD10201
The other data source used is the operational North Atlantic & Europe (NAE) model analysis from the Met Office, UK.
Gerard van der Schrier, Else van den Besselaar, Robert Leander, Gé Verver, Albert Klein Tank, Jules Beersma, Geert Jan van Oldenborgh, Maarten Plieger (KNMI, The Netherlands), Richard Renshaw (Met Office, UK), Peter Bissoli (Deutscher Wetterdienst, Germany).
Please send your questions, remarks, suggestions to EURO4M.
This article is a Climate Indicator Bulletin (CIB) which is part of EURO4M and has received funding from the European Union, Seventh Framework Programme (FP7/2007-2013) under grant agreement n° 242093.