Projects

Projects from the department of Observations & Data Technology
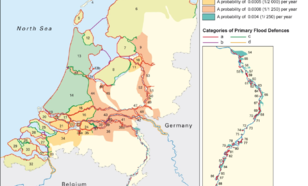
  1. Figure 1: The safety standards of the Dutch primary water defenses. According to the Dutch Water Act (Waterwet, 2009) the safety of the Dutch primary water defenses must be assessed every six years (2011, 2017, ...).
    Loads of Water Defenses

    This project is about determining extreme winds, water levels and wave conditions that the Dutch primary water defenses should be able to withstand.
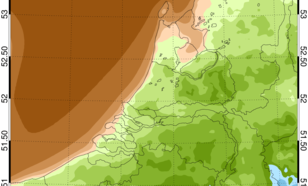
  2. Average wind speed 1979-2013 at 100 m height
    KNW Atlas

    The KNMI North Sea Wind (KNW) Atlas provides wind climatology for the North Sea and the Netherlands.
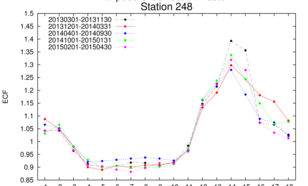
  3. Example of ECF analyses at Wijdenes. The ECFs in 20131201-20140331 are temporarily higher in sectors 16-18 (305-04°) due to reconstruction work on the dike (which is closest to the wind mast in sectors 13-15). Lake IJssel lies just a short
    Potential wind

    The effect of obstacles on wind measurements needs to be filtered out.
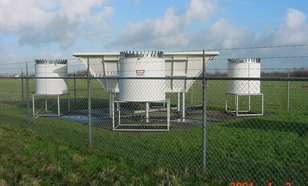
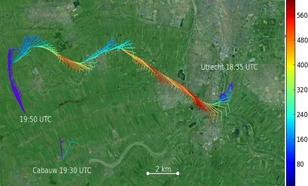
  4. Wind profiler system. Radar system measuring winds between 200 en 4000 m.
    CESAR (Cabauw) and wind

    Cabauw Experimental Site for Atmospheric Research
  5. Weather 3D eXplorer:  Meteo-data above Europe
    Weather 3D eXplorer

    3D meteo-visualization

  6. Homepage of the I-DARE portal
    The International Data Rescue (I-DARE) Portal

    The I-DARE Portal provides a single point of entry for information on the status of past and present worldwide to be rescued data and data rescue projects, and on best methods and technologies involved in data rescue.

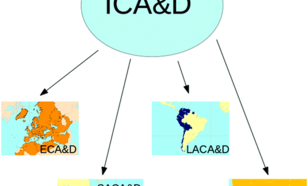
  7. Fig. 1. Schematic representation of ICA&D and its regional implementations. ECA&D: Europe & Middle East; SACA&D: Southeast Asia; LACA&D: Latin America; WACA&D: West Africa.
    The International Climate Assessment & Dataset

    The International Climate Assessment & Dataset (ICA&D) provides climate services on a regional scale for users in participating countries and the broader scientific community.
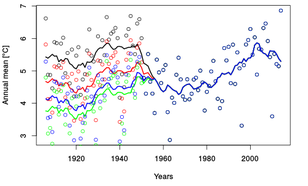
  8. Temperature timeseries resulting from different homogenisation methods. For further explanation see main text.
    EUSTACE

    EU Surface Temperature for All Corners of Earth
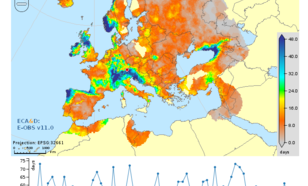
  9. Figure 1: Annual Heavy precipitation days (R10mm)
    EUPORIAS

    European Provision of Regional Impacts Assessments on Seasonal and Decadal Timescales
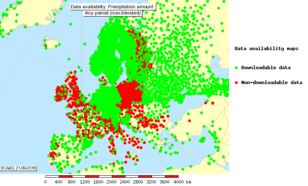
  10. Figure 1: Station locations in ECA&D providing daily precipitation sums.
    The European Climate Assessment & Dataset

    In order to facilitate climate research on the European domain, the European Climate Assessment & Dataset (ECA&D) has been developed.
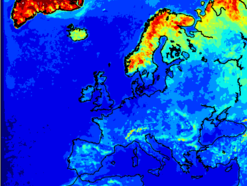
  11. SMHI has run two 5-year reanalyses (2006-2010) with two model versions, to provide some feeling for the uncertainty or differences due to model differences. An example of the standard deviation of differences is shown above.
    UERRA

    Uncertainties in Ensembles of Regional ReAnalyses

  12. KNMI Datalab
    KNMI DataLab

    The KNMI DataLab leads KNMI into the Big Data & Data Science era.
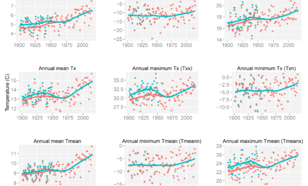
  13. Figure 1. Comparsion of Tn, Tx, and Tmean before (bluegreen) and after (redorange)  homogenization for De Bilt 1901-2015.
    Climatological studies

    Homogeneous time series of daily precipitation, temperature, and other meteorological variables are indispensable for climate change and variability studies
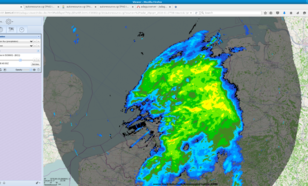
  14. Visualization of precipitation from KNMI radars above the Netherlands during a heavy rainstorm.
    ADAGUC

    Atmospheric data access for the geospatial user community
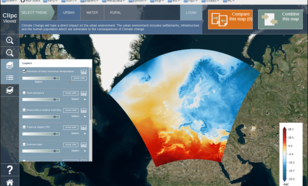
  15. CLIPC
    CLIPC: Climate Information Portal for Copernicus

    CLIPC is a portal to provide a single point of access for scientific information on climate change. This is made possible through the Copernicus Earth Observation Programme for Europe, which will deliver a new generation of environmental data.