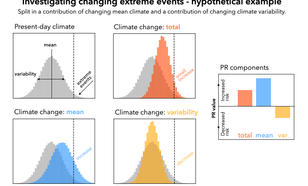
Extreme weather events are projected to change due to climate change, the risks to societies are therefore also changing. In a new study published in Communications Earth and Environment, Dr. Karin van der Wiel (KNMI) and Prof. Richard Bintanja (KNMI, Univ. Groningen) demonstrate that the increased occurrence of monthly extreme heat events is predominantly caused by a warming mean climate. In contrast, future changes in monthly heavy rainfall events depend to a considerable degree on changes in climate variability. Examining the origin of changes in extreme events, changing mean or changing variability, provides valuable insights into the processes driving these important climatic changes.
Quantifying future extreme events
Extreme weather events, such as heatwaves, droughts or heavy rainfall events, pose a risk to societies and ecosystems. Climate change leads to a change in the frequency or severity of these events and as a result societal risks change as well. Understanding future changes in extreme events is therefore of broad interest.
To understand extreme events, two aspects of climate are important: the mean climate and climate variability. Both are subject to climate change, though the changes can be caused by different physical processes. Consequently the two aspects may change in different ways and impact extreme events in different, sometimes opposing, ways (Figure 1). In this new study we extend the concept of Probability Ratio (PR), measuring the changes in extreme event frequency, to quantify the individual contribution of a changing mean climate and a changing climate variability to the overall trend in extreme event frequency.
Drivers of change: changing mean and/or changing variability
Using state-of-the-art large ensemble climate modelling experiments, the changing frequency of monthly high-temperature and heavy-precipitation is investigated. The research shows that the change in high-temperature events can for a very large part be explained by changing mean climate (Figure 2). Interestingly, heavy-precipitation events are strongly affected by changing variability (Figure 3). Differences in regional climate processes, such as the presence of sea ice or atmospheric rivers, lead to spatial differences in the mean/variability split. However, the individual contributions are robust across different levels of climate change, different definitions of extremeness and different climate models. The newly defined split thus seems to capture a fundamental aspect of climate change.
Lead author Karin van der Wiel says “The new information on the fundamental contributors to changing climate extremes helps to understand the physical mechanisms that lead to these changes. Better understanding will improve our climate projections, and will help to inform society on future risks.” This work will be continued in the VAREX project.

Van der Wiel and Bintanja (2021): Contribution of climatic changes in mean and variability to monthly temperature and precipitation extremes. Communications Earth and Environment, 2, 1.